Memory Profiling with Memray
Airflow integrates Memray, a memory profiler for Python, to help you diagnose memory usage patterns and identify potential memory leaks in Airflow components. This guide will walk you through how to profile memory usage in key Airflow components such as the scheduler, API server, DAG processor and triggerer.
Note
Memory profiling is an expensive operation and should generally only be used for debugging purposes in development. It is not recommended for production use. See Precautions for important precautions.
Prerequisites
Before you can use memory profiling, you need to install Airflow with the memray extra:
pip install 'apache-airflow[memray]'
Alternatively, if you have an existing Airflow installation:
pip install 'memray>=1.19.0'
Note
For more information about supported environments, see the Memray supported environments documentation.
Configuring Memory Profiling
Memory profiling is controlled through Airflow’s configuration. You can enable it for specific
components by setting the memray_trace_components option in the [profiling] section of your
airflow.cfg file or through environment variables.
Configuration Options
Add the following to your airflow.cfg file:
[profiling]
# Comma-separated list of Airflow components to profile with memray
# Valid components: scheduler, api, dag_processor, triggerer
# Invalid component names will be ignored
memray_trace_components = scheduler,dag_processor,api, triggerer
Or set it via environment variable:
export AIRFLOW__PROFILING__MEMRAY_TRACE_COMPONENTS="scheduler,dag_processor,api,triggerer"
Note
To disable memory profiling after you’ve completed your analysis, simply set
memray_trace_components to an empty string (or unset the environment variable)
and restart the affected components.
Capturing More Detailed Traces
If the default trace does not give you enough information to identify the source of
a memory issue, enabling memray_detailed_tracing provides deeper insight.
By default, Memray only records allocations that reach the system allocator. To also
capture C/C++ stack frames and small pymalloc allocations, set
memray_detailed_tracing to True:
[profiling]
memray_trace_components = scheduler
memray_detailed_tracing = True
This enables Memray’s native_traces (C/C++ frames from compiled extensions such as
numpy or pandas; most accurate on Linux, less precise on macOS) and
trace_python_allocators (small short-lived Python objects served from existing
pymalloc arenas).
Warning
Detailed tracing substantially increases overhead and can produce profile files several gigabytes in size. Enable it for short, focused sessions only.
Step-by-Step Profiling Guide
This section provides a practical walkthrough of how to profile memory usage in your Airflow deployment.
Step 1: Enable Memory Profiling
First, decide which component you want to profile. For this example, let’s profile the scheduler.
Edit your airflow.cfg:
[profiling]
memray_trace_components = scheduler
Or set the environment variable:
export AIRFLOW__PROFILING__MEMRAY_TRACE_COMPONENTS=scheduler
Step 2: Restart the Component
After enabling profiling for a component, you need to restart it for the changes to take effect.
# If running standalone
airflow scheduler

# If running with systemd
sudo systemctl restart airflow-scheduler

# If running with Docker Compose
docker-compose restart airflow-scheduler
Step 3: Run Your Workload
Let Airflow run normally and perform the operations you want to profile. For example:
Let the scheduler run for a period of time
Process specific DAG files that may be problematic
The longer you let it run, the more data you’ll collect. However, keep in mind that memory profiling adds overhead, so a few minutes to an hour is usually sufficient for diagnosis.
Step 4: Retrieve the Profile File
Memray will automatically generate a binary profile file in your $AIRFLOW_HOME directory.
The filename follows the pattern <component>_memory.bin:
# Default locations
$AIRFLOW_HOME/scheduler_memory.bin
$AIRFLOW_HOME/api_memory.bin
$AIRFLOW_HOME/dag_processor_memory.bin
$AIRFLOW_HOME/triggerer_memory.bin
If running in a containerized environment, you may need to copy the file from the container:
# Docker
docker cp <container_name>:/path/to/airflow/home/scheduler_memory.bin .

# Kubernetes
kubectl cp <namespace>/<pod_name>:/path/to/airflow/home/scheduler_memory.bin ./scheduler_memory.bin
Step 5: Analyze the Profile
Once you have the profile file, use Memray’s analysis tools to visualize and understand the memory usage.
Generate a Flamegraph
The flamegraph is the most common way to visualize memory allocations:
memray flamegraph scheduler_memory.bin
This will generate an HTML file (memray-flamegraph-scheduler_memory.html) that you can open in a web browser.
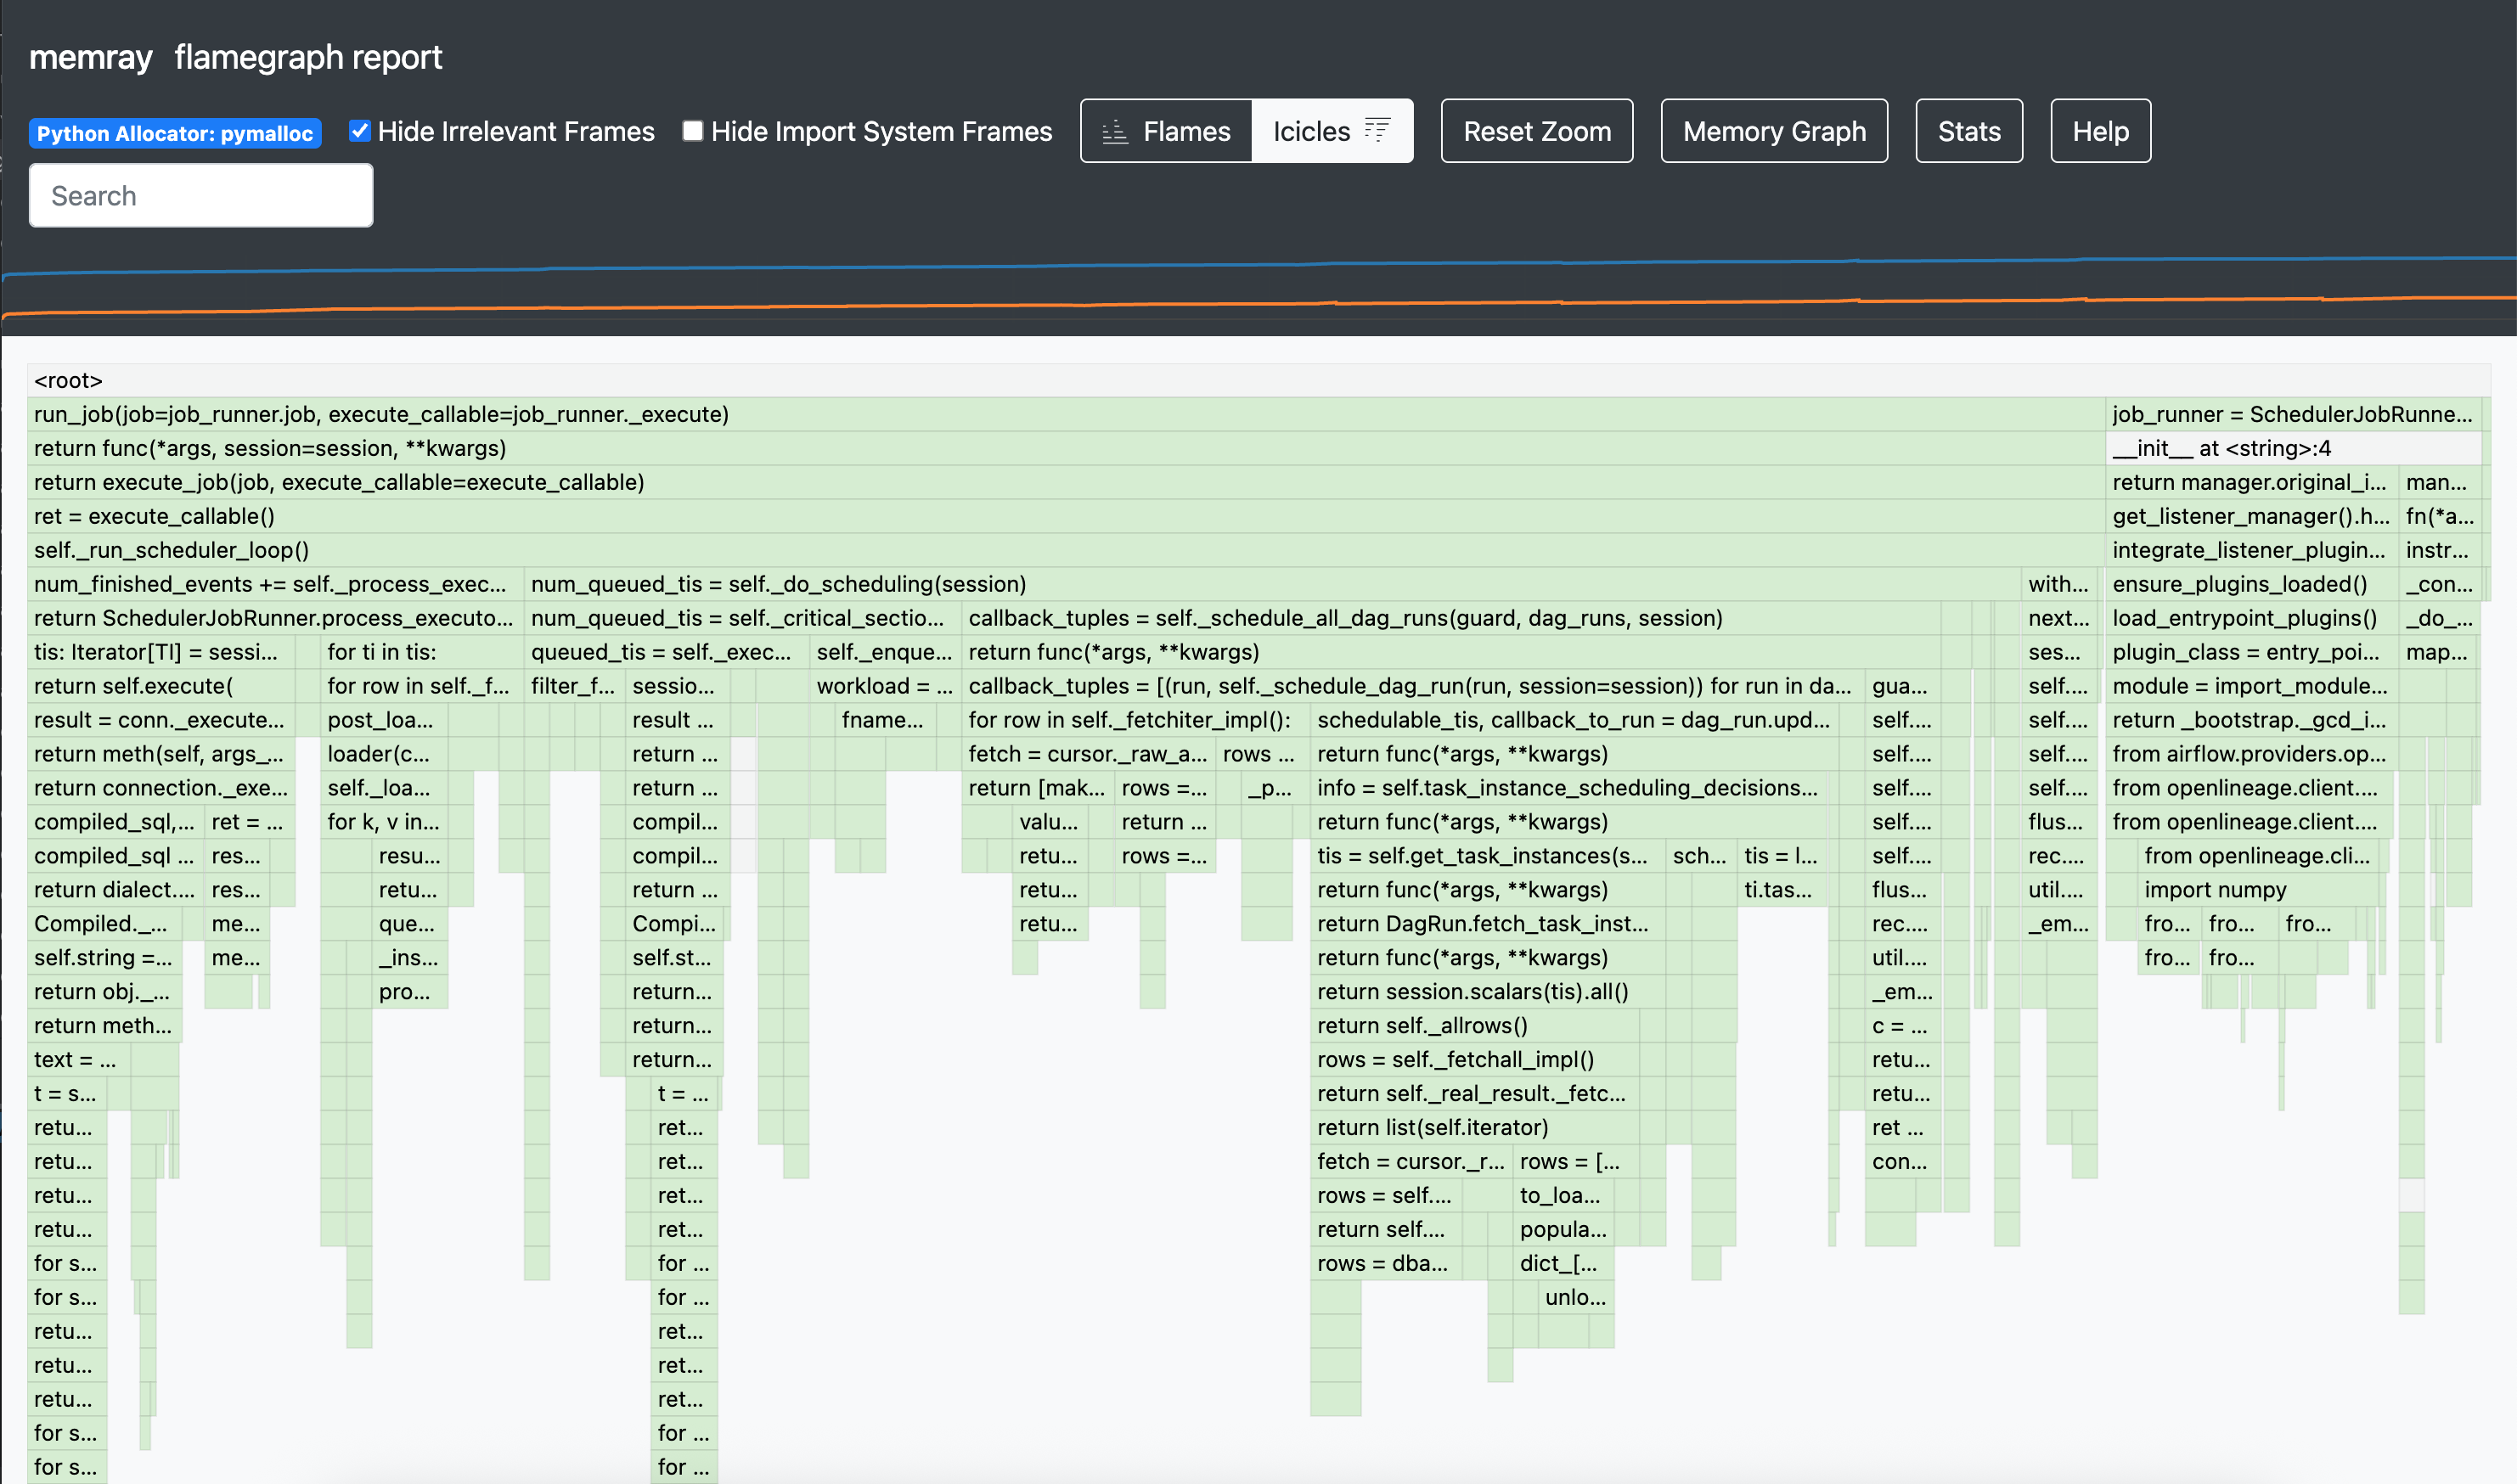
The flamegraph shows the call stack with the width of each box representing the amount of memory allocated by that function. Functions at the top of the graph are leaf functions that directly allocate memory.
Other Analysis Methods
Memray provides several other ways to analyze memory profiles, including table reports, summary statistics, live monitoring, and more. For detailed information on all available analysis commands and options, refer to the Memray documentation on analyzing results.
Interpreting Results
When analyzing your memory profile, look for:
- High Memory Allocation Functions
Functions that allocate large amounts of memory or are called frequently. These are the widest bars in the flamegraph or top entries in the table report.
- Memory Retention Patterns
If you see certain functions consistently holding memory over time, this could indicate a memory leak.
- Unexpected Allocations
Look for memory allocations in places you wouldn’t expect, which might indicate inefficient code or unnecessary data structures.
- Third-Party Library Usage
Sometimes memory issues are caused by how third-party libraries are used. The flamegraph will show you if a particular library is responsible for high memory usage.
Precautions
Profile in Non-Production Environments Memory profiling adds significant overhead, including increased memory usage and performance degradation. Use it in development that mirror your production setup.
Use Representative Workloads Ensure the workload you’re profiling is representative of your actual use case.
Manage Profile File Sizes Profile files can grow very large (hundreds of MB to several GB) and may consume significant disk space. Monitor available disk space during profiling sessions and regularly clean up old profile files after analysis to prevent storage issues.
Further Reading
For more detailed information about Memray and its capabilities, refer to the official documentation: