Logging and Monitoring architecture
Airflow supports a variety of logging and monitoring mechanisms as shown below.
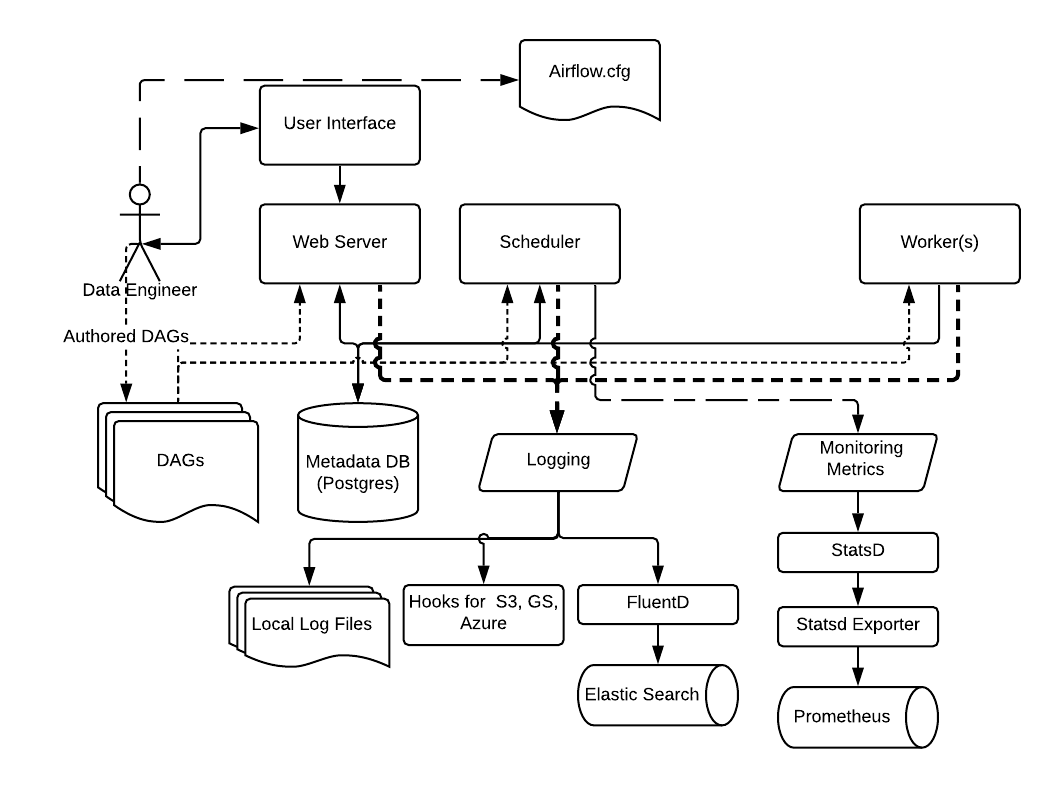
By default, Airflow supports logging into the local file system. These include logs from the Web server, the Scheduler, and the Workers running tasks. This is suitable for development environments and for quick debugging.
For cloud deployments, Airflow also has task handlers contributed by the Community for logging to cloud storage such as AWS, Google Cloud, and Azure.
The logging settings and options can be specified in the Airflow Configuration file, which as usual needs to be available to all the Airflow process: Web server, Scheduler, and Workers.
Default Airflow loggers
Airflow uses Python’s standard logging framework, and most loggers follow the Python package and module naming convention. A few logger names are useful to know when reading logs or customizing logging behavior:
root: the root Python logger. During task execution, Airflow configures the root logger so standard Python loggers that propagate to it can write to the task log.airflow.task: the parent logger for task logs. Operators and hooks use child loggers under this namespace, such asairflow.task.operatorsandairflow.task.hooks.airflow.processor: used by Dag file processing code, including messages emitted while parsing Dag files.airflow.processor_manager: used by the scheduler’s Dag processor manager to report Dag processing activity.flask_appbuilder: used by Flask-AppBuilder in the webserver. Airflow’s default logging configuration keeps this logger less verbose than Airflow’s own component loggers.
Task logs are configured separately from other component logs because they must be grouped by task instance and made available in the Airflow UI. For task log file layout and remote task logging settings, see Logging for Tasks.
For custom handlers, custom logger levels, or per-operator and per-task logger configuration, see Advanced logging configuration.
You can customize the logging settings for each of the Airflow components by specifying the logging settings in the Airflow Configuration file, or for advanced configuration by using advanced features.
For production deployments, we recommend using FluentD to capture logs and send it to destinations such as ElasticSearch or Splunk.
Note
For more information on configuring logging, see Logging for Tasks
Similarly, we recommend using StatsD for gathering metrics from Airflow and send them to destinations such as Prometheus.
Note
For more information on configuring metrics, see Metrics Configuration